MIBI
[1]:
import os
import pandas as pd
import numpy as np
import scanpy as sc
import anndata as ad

import matplotlib.pyplot as plt
import seaborn as sns
[2]:
import pysodb
[3]:
sc.set_figure_params(vector_friendly=False,format='pdf',transparent=True,dpi=50)
plt.rcParams["figure.figsize"] = (8, 8)

sns.set_style('white')
load a data using pysodb
[4]:
sodb = pysodb.SODB() # Initialization
/home/yzy/anaconda3/envs/SODB/lib/python3.9/site-packages/urllib3-1.26.12-py3.9.egg/urllib3/connectionpool.py:1045: InsecureRequestWarning: Unverified HTTPS request is being made to host 'gene.ai.tencent.com'. Adding certificate verification is strongly advised. See: https://urllib3.readthedocs.io/en/1.26.x/advanced-usage.html#ssl-warnings
  warnings.warn(
[ ]:
# this data is from publication "A Structured Tumor-Immune Microenvironment in Triple Negative Breast Cancer Revealed by Multiplexed Ion Beam Imaging"
[ ]:
# link in SODB: https://gene.ai.tencent.com/SpatialOmics/dataset?datasetID=47
[8]:
adata = sodb.load_experiment('keren2018a','p4')
# the first parameter is the name of the dataset
# the second parameter is the name of one experiment in the dataset
download experiment[p4] in dataset[keren2018a]
100%|██████████████████████████████████████████████████████████████████████████████████████████████████████████████████████████████████████████████████████████████████████████████████████████████████████████████████████████████████████| 6.59M/6.59M [00:01<00:00, 5.24MB/s]
load experiment[p4] in dataset[keren2018a] from /home/yzy/anaconda3/envs/SODB/lib/python3.9/site-packages/pysodb-1.0.0-py3.9.egg/pysodb/cache/keren2018a/p4.h5ad
identify clusters
[10]:
sc.pp.pca(adata)
sc.pp.neighbors(adata)
sc.tl.umap(adata)
sc.tl.leiden(adata, key_added="clusters")
/home/yzy/anaconda3/envs/SODB/lib/python3.9/site-packages/tqdm-4.64.1-py3.9.egg/tqdm/auto.py:22: TqdmWarning: IProgress not found. Please update jupyter and ipywidgets. See https://ipywidgets.readthedocs.io/en/stable/user_install.html
  from .autonotebook import tqdm as notebook_tqdm
[12]:
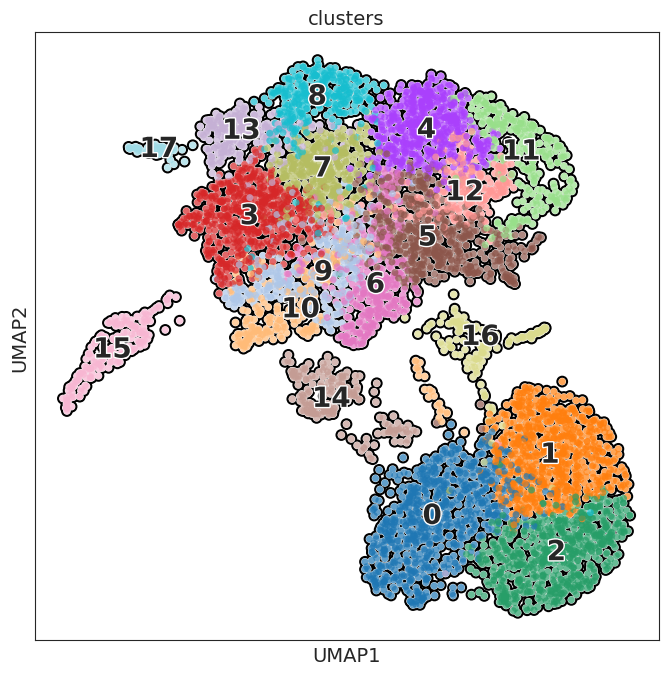
sc.pl.umap(adata, color=[ "clusters"], wspace=0.4,
          add_outline=True,legend_fontsize=20, legend_fontoutline=2,
            legend_loc='on data',
            s=100
          )
[15]:
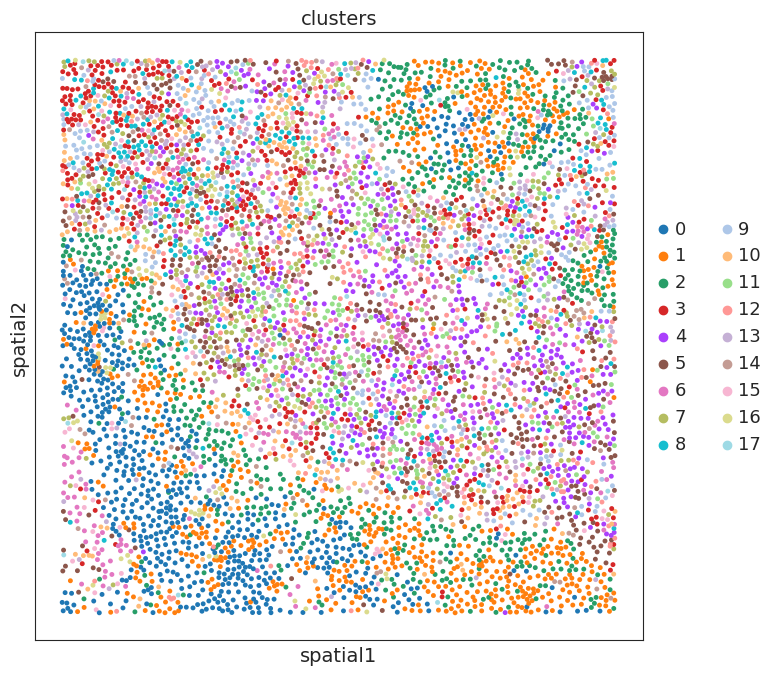
# plt.rcParams["figure.figsize"] = (8, 8)
sc.pl.embedding(adata, basis='spatial', color=['clusters'],show=False,size=50,add_outline=False)
plt.gca().set_aspect('equal', adjustable='box')
marker gene detection
[ ]:
sc.tl.rank_genes_groups(adata, "clusters", method="t-test")
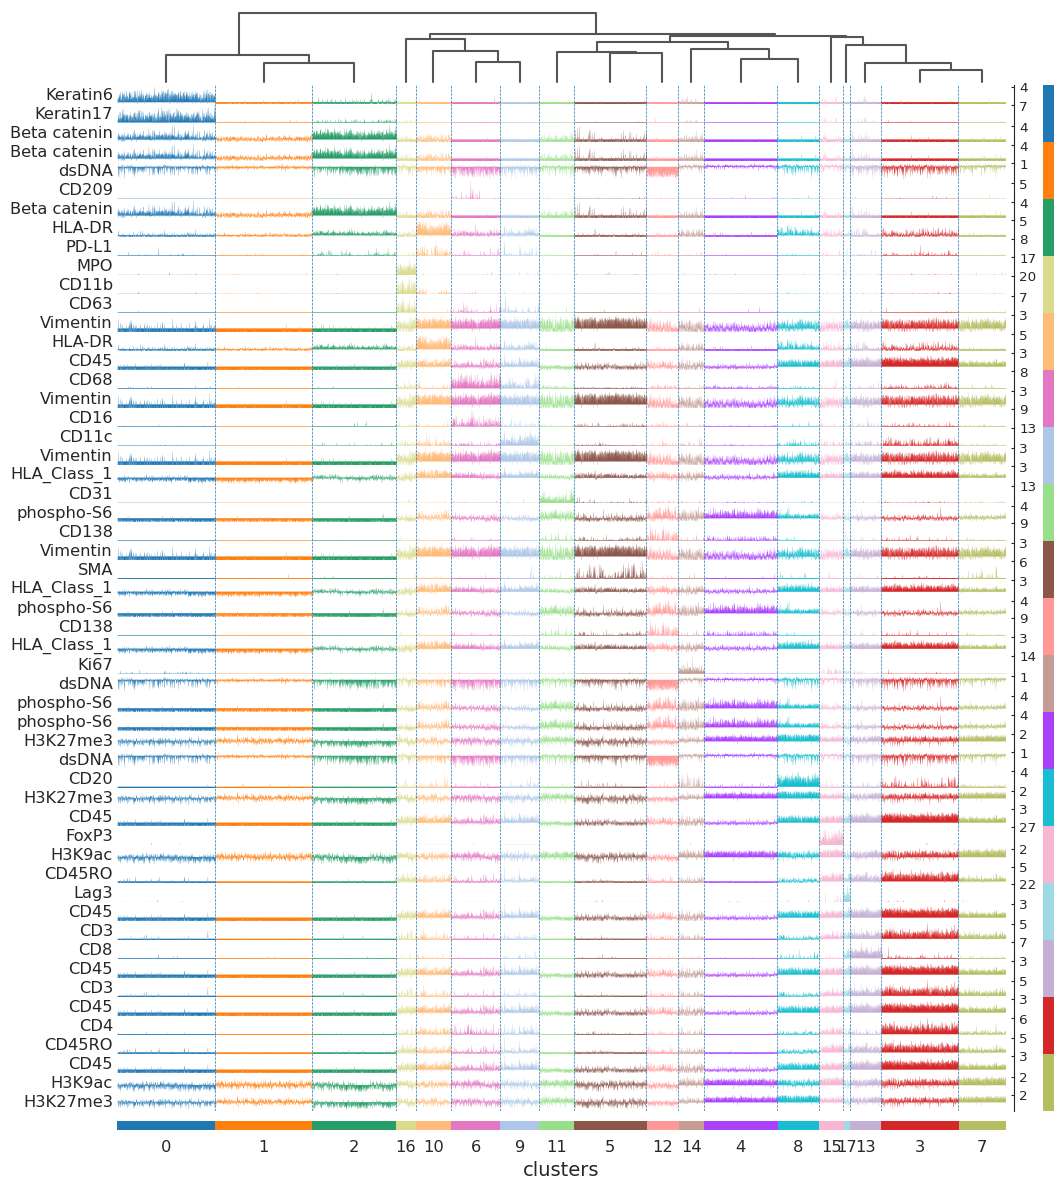
[21]:
sc.pl.rank_genes_groups_tracksplot(adata, n_genes=3, groupby="clusters")
/home/yzy/anaconda3/envs/SODB/lib/python3.9/site-packages/scanpy-1.9.1-py3.9.egg/scanpy/plotting/_anndata.py:2414: FutureWarning: iteritems is deprecated and will be removed in a future version. Use .items instead.
  obs_tidy.index.value_counts(sort=False).iteritems()
[55]:
adata
[55]:
AnnData object with n_obs × n_vars = 2179 × 32268
    obs: 'col_0', 'leiden', 'clusters'
    var: 'gene_ids', 'feature_types', 'genome', 'highly_variable', 'means', 'dispersions', 'dispersions_norm'
    uns: 'hvg', 'leiden', 'leiden_colors', 'log1p', 'moranI', 'neighbors', 'pca', 'spatial_neighbors', 'umap', 'clusters_colors', 'rank_genes_groups', 'dendrogram_clusters'
    obsm: 'X_pca', 'X_umap', 'spatial', 'spatial_pixel', 'spatial_real'
    varm: 'PCs'
    obsp: 'connectivities', 'distances', 'spatial_connectivities', 'spatial_distances'
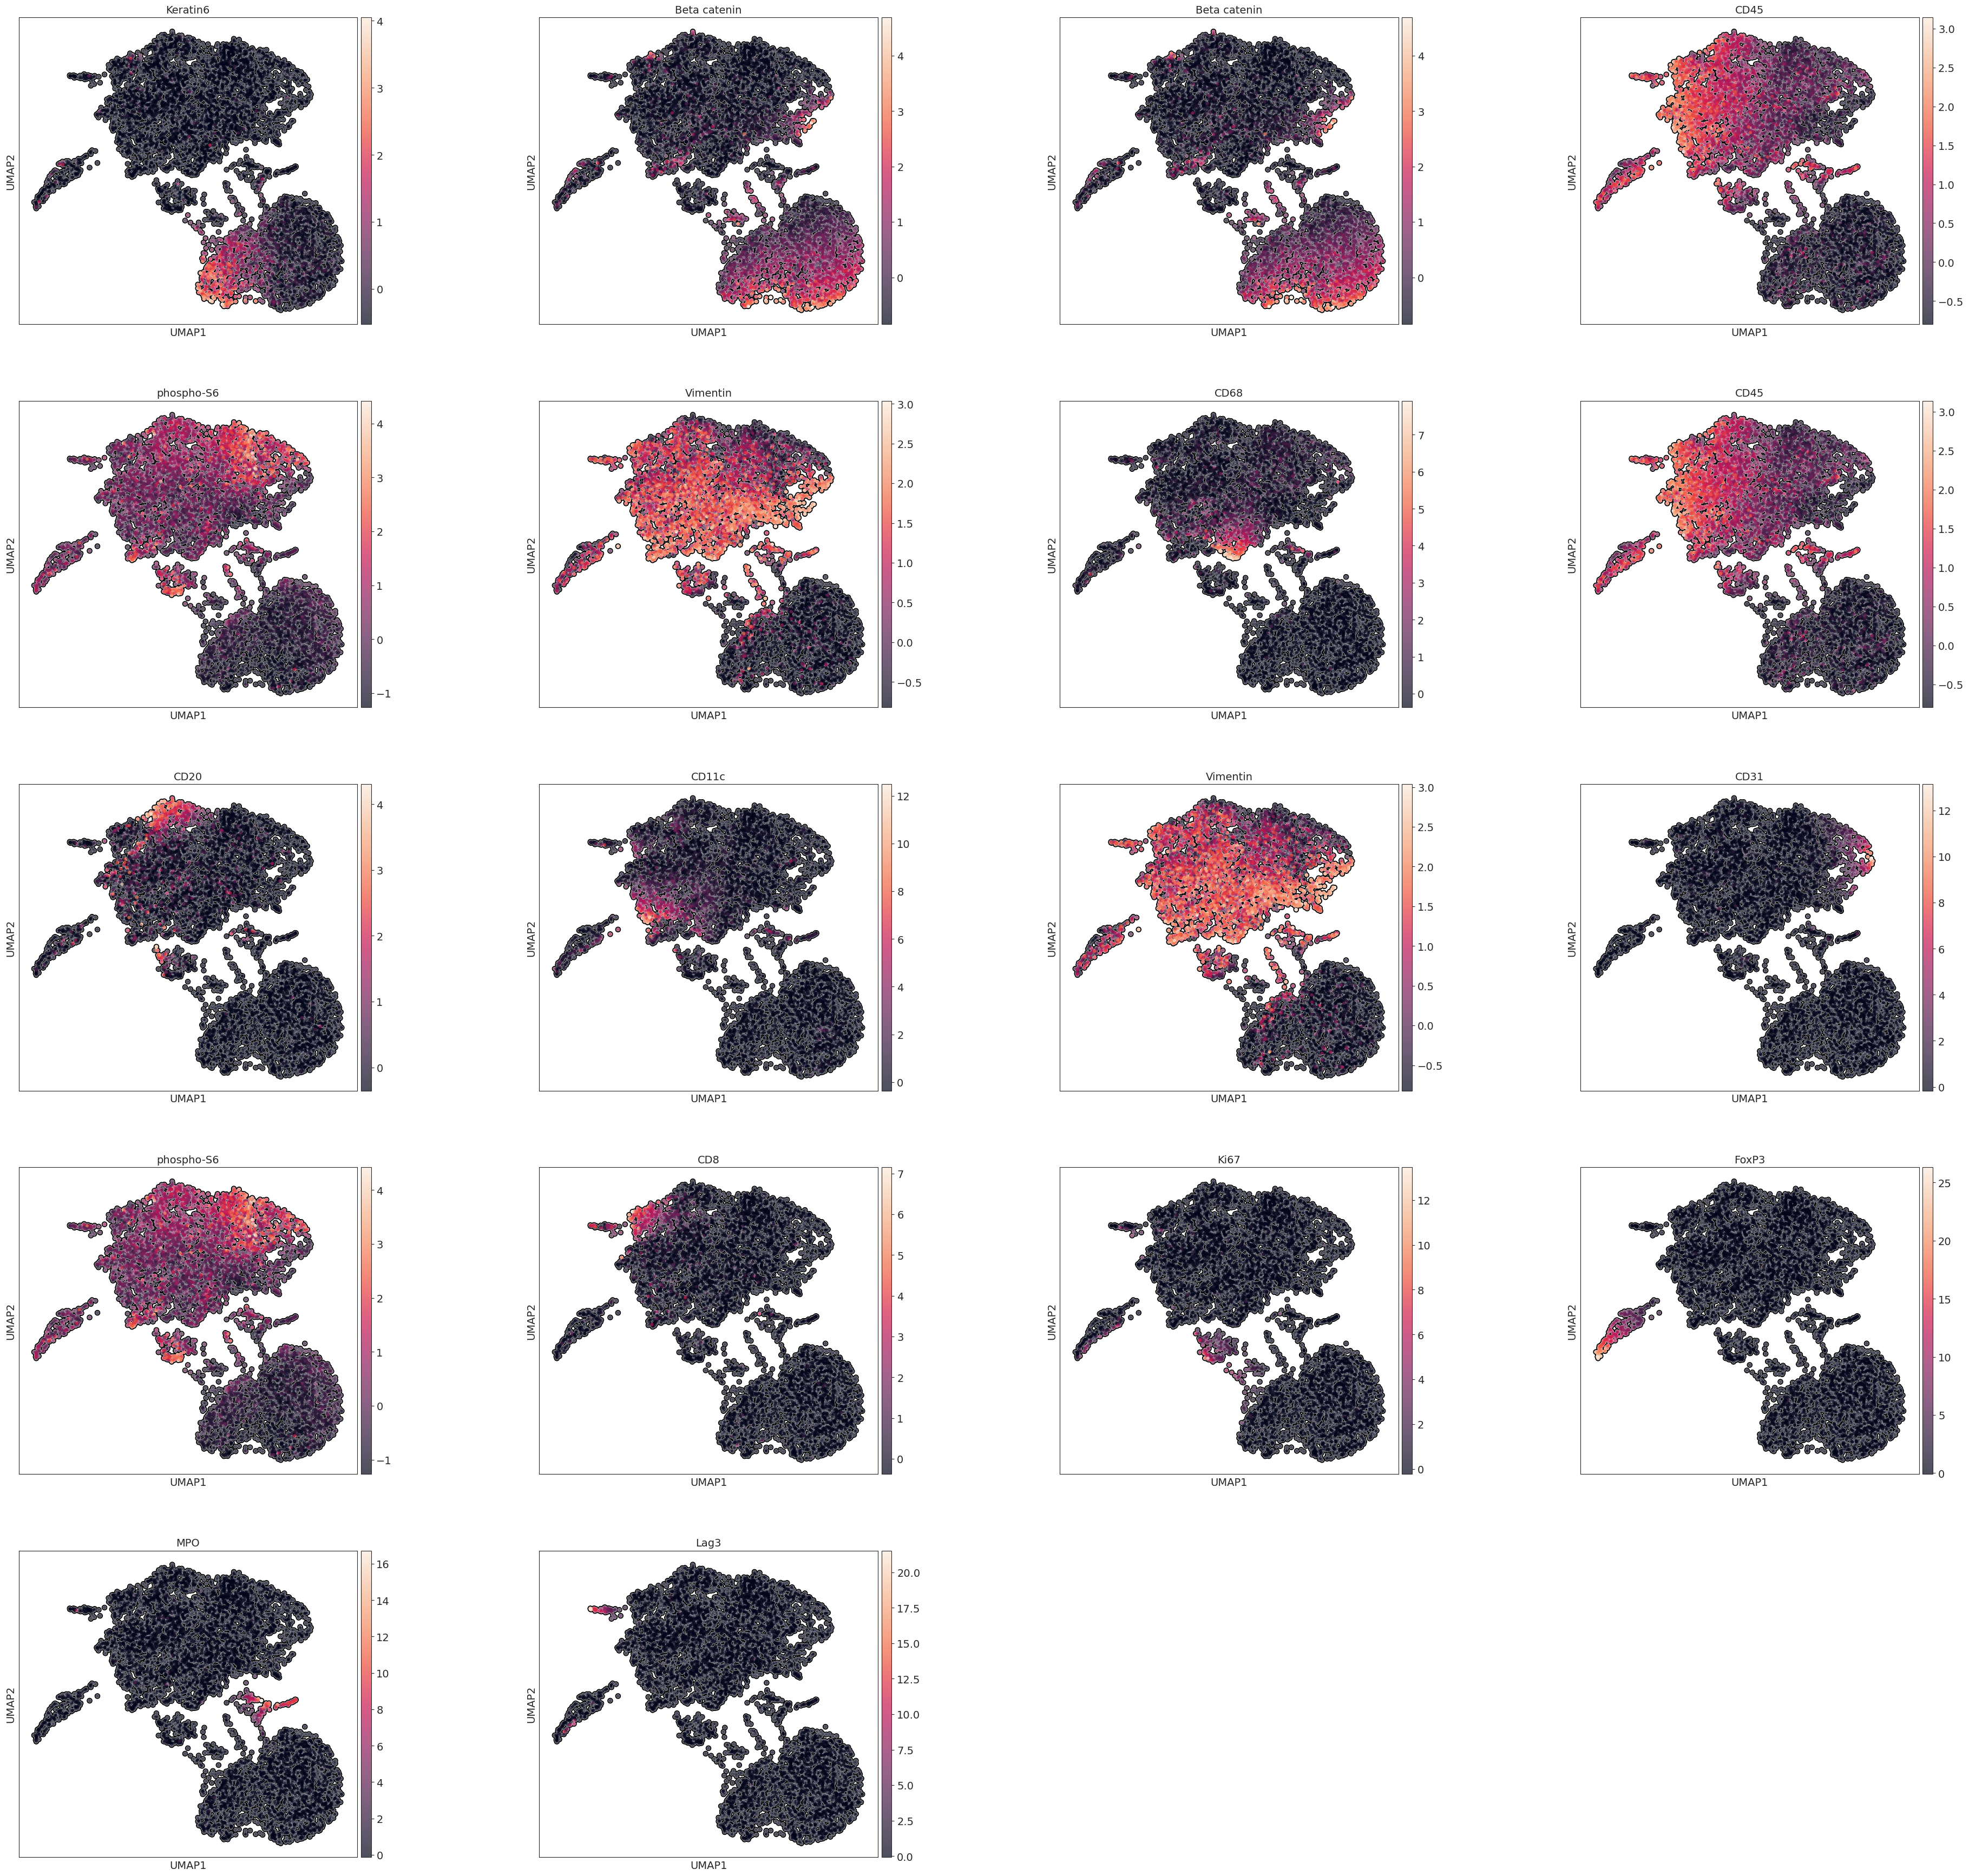
[17]:
marker_genes = adata.uns['rank_genes_groups']['names'][0]
[18]:
sc.pl.umap(adata, color=marker_genes, wspace=0.4,
          add_outline=True,legend_fontsize=10, legend_fontoutline=2,
            legend_loc='on data',
            s=80
          )
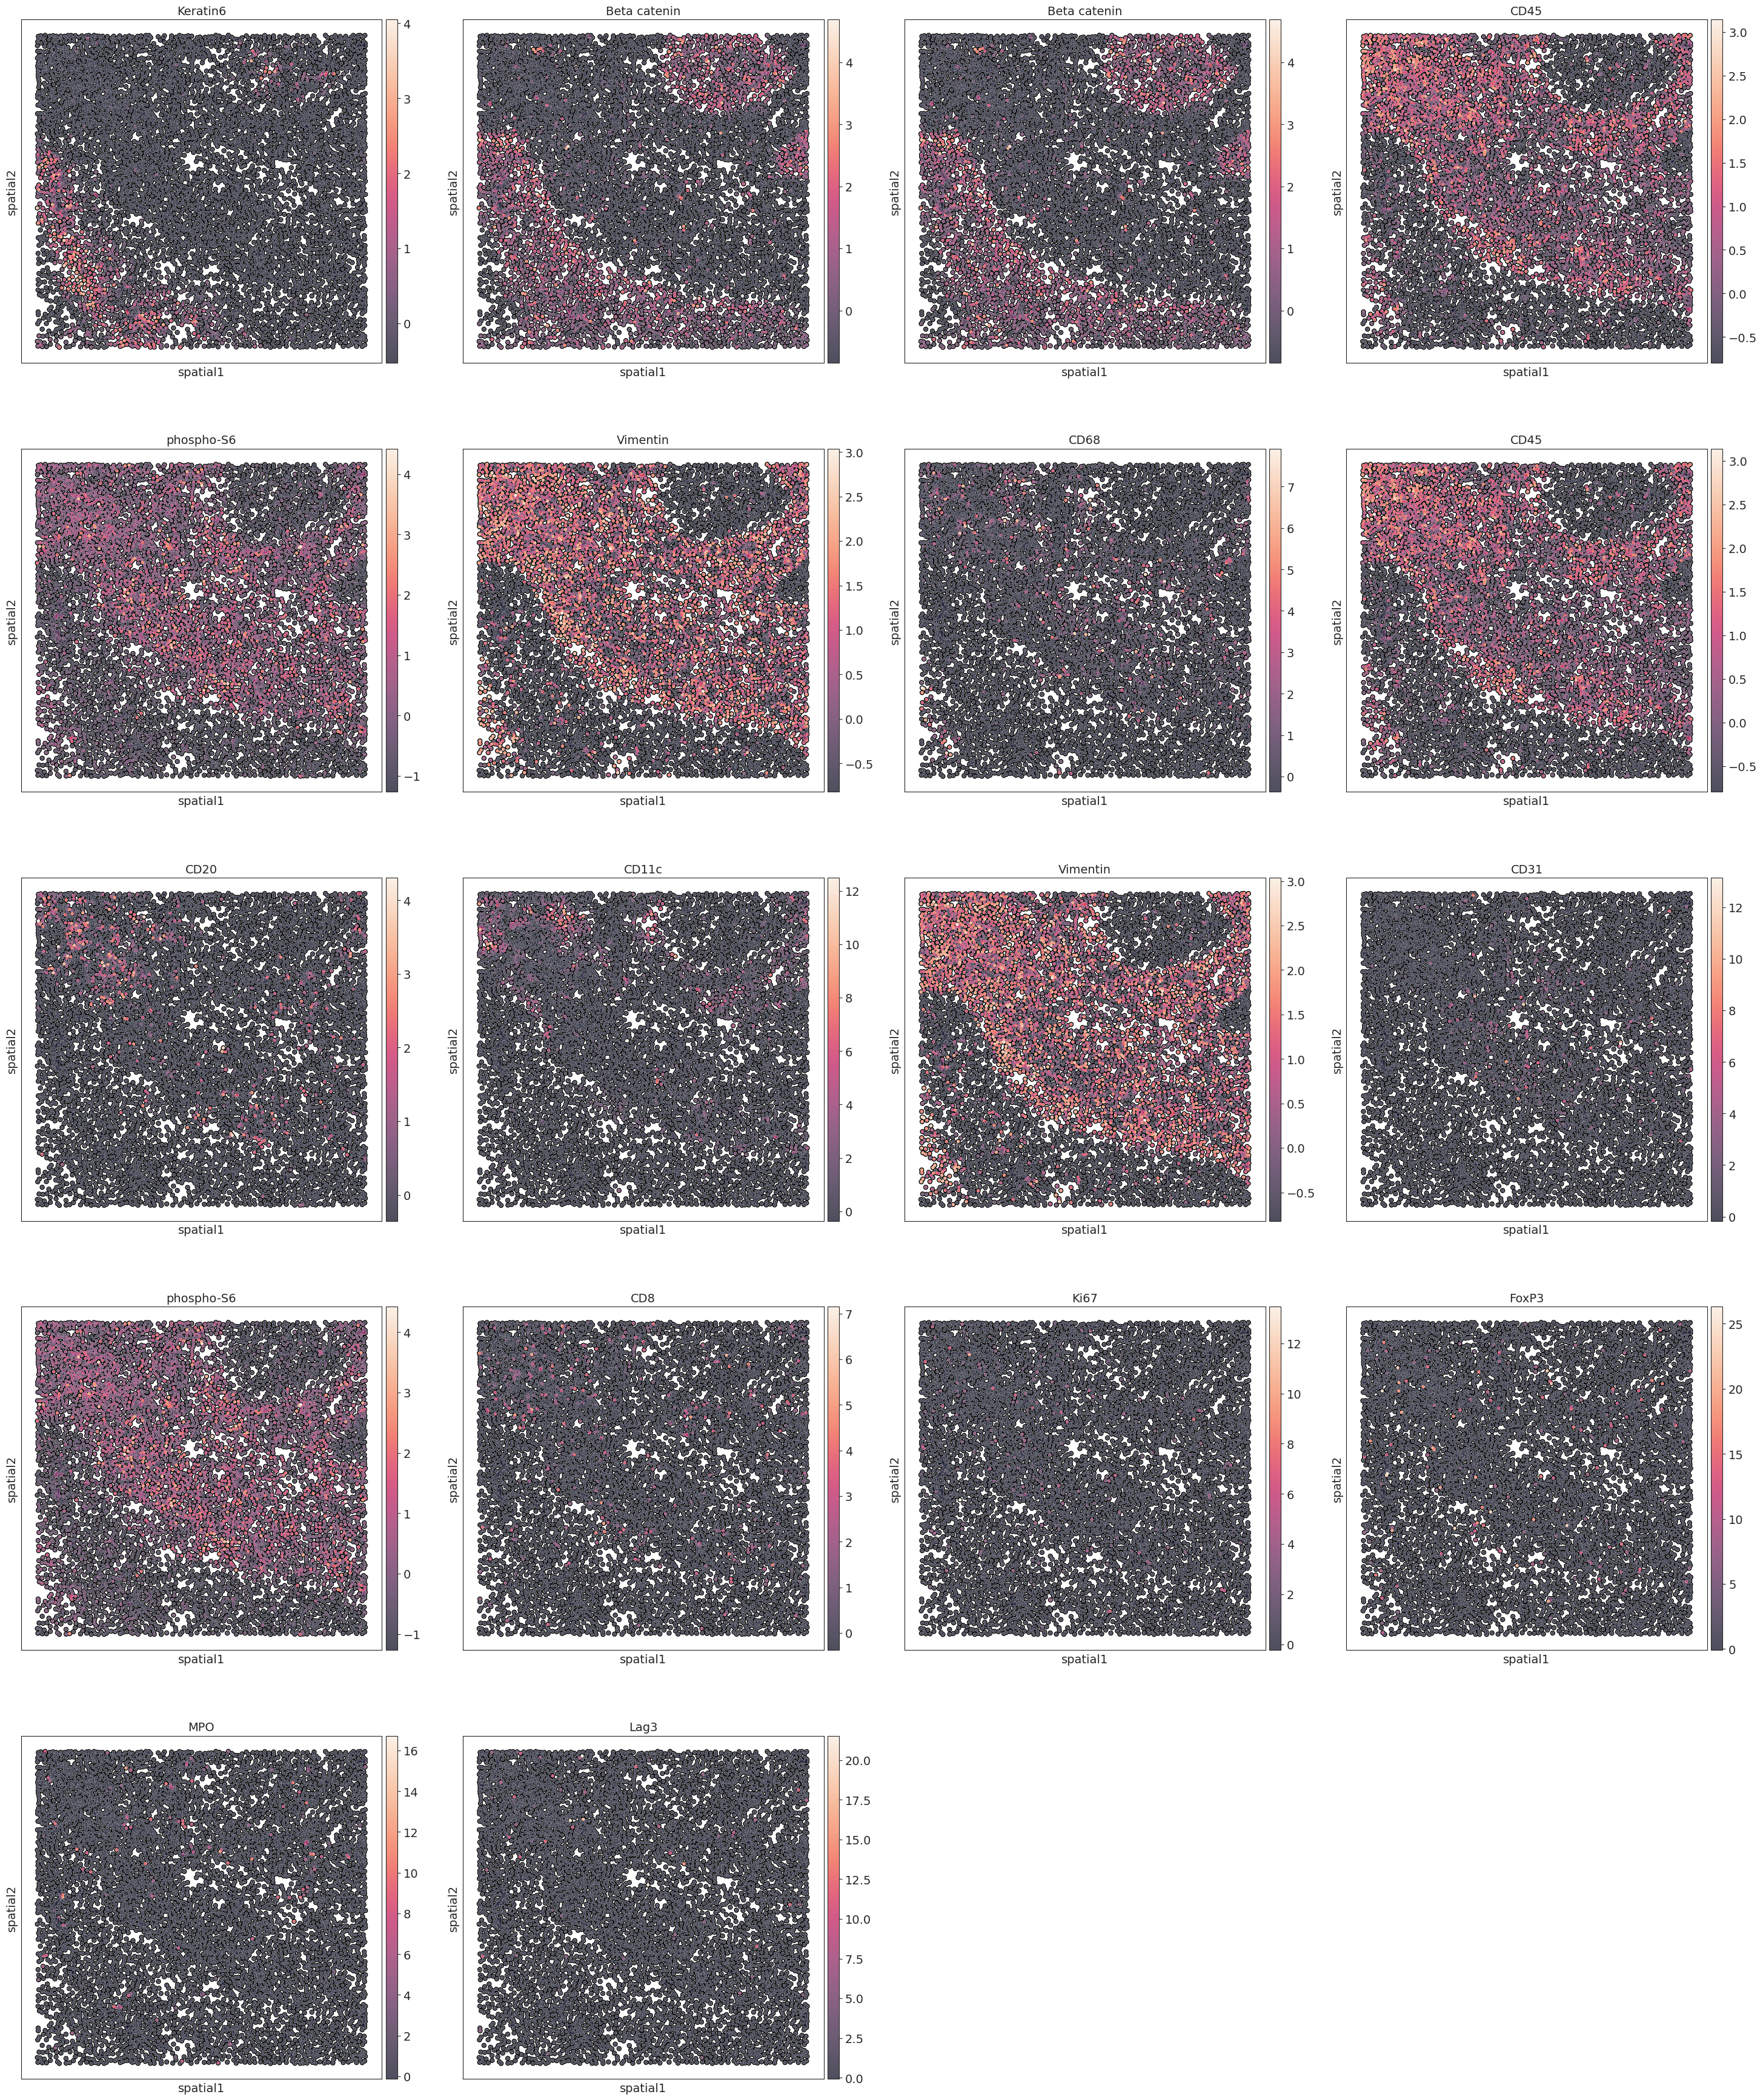
[19]:
# plt.rcParams["figure.figsize"] = (8, 8)
sc.pl.embedding(adata, basis='spatial', color=marker_genes,size=50,add_outline=True)
[ ]: